CNS Lab
Team
Prof. Piotr Bogorodzki, PhD, DSc, Eng., Head of the Laboratory
Ewa Piątkowska-Janko, PhD
Michał Kacprzak, PhD
Nikodem Hryniewicz, PhD, Eng.
Kamil Lipiński, MSc, Eng.
General information
The objective of the Lab functioning
CNSLab is an interdisciplinary research team specializing in structural and functional brain studies using magnetic resonance imaging techniques. The laboratory develops advanced techniques, including spectroscopy and proton imaging, extended with the ability to study C¹³, F¹⁹, and P³¹ isotopes for metabolic and chemical tissue analysis. Diffusion-weighted imaging (DWI) and perfusion imaging (pMRI) methods, as well as simultaneous EEG-fMRI measurements, are also being developed. CNSLab is equipped with the infrastructure to conduct research and clinical experiments.
The laboratory has extensive collaborations with other institutions (including the Medical University of Warsaw, Warsaw University of Technology, the Nencki Institute of Experimental Biology PAS, and SWPS University).
Research and Facility Infrastructure
To enable the implementation of the aforementioned work, the laboratory is equipped with specialized research equipment. The primary element is the Discovery MR750w 3.0T magnetic resonance scanner (General Electric). The system is equipped with a 3T magnetic field induction magnet and a 70 cm diameter (wide bore) as well as an additional multinuclear acquisition path, enabling the selection of frequency depending on the analyzed element.
Functional magnetic resonance imaging (fMRI) studies are supported by a system for presenting and recording multimedia stimuli, complemented by the NeuroScan brain bioelectric activity recorder (EEG), which allows simultaneous EEG-fMRI measurements. Additionally, the laboratory is equipped with high-resolution brain oxygenation topography (HD-DOT) recording equipment that uses near-infrared technology.
Projects
Projects Conducted in CNSLab
- 12021/ABM/02/00002 - 00 - CLASP-MS - “Study to evaluate the efficacy and safety of Polish cladribine in the treatment of patients with secondary progressive multiple sclerosis - a phase 2, randomised, double-blind, placebo-controlled study”.
- “Tracking of epileptic discharges with simultaneous EEG-fMRI scanning” (Decision 6/2021 of the Ethics Committee reviewing biomedical research at the Military Institute of Aviation Medicine in Warsaw).
CNS Lab - Methods
functional Magnetic Resonance Imaging (fMRI)
- The laboratory is equipped with the necessary systems to conduct functional magnetic resonance imaging (fMRI) studies.
- Structural and functional images are recorded using the Discovery MR750w 3.0T magnetic resonance scanner (General Electric).
- Multimedia stimuli presentation and recording of the subject’s responses are carried out through the NNL system and Presentation software.
Example Results of fMRI Analysis
EEG-fMRI
The EEG-fMRI method allows for simultaneous recording of data from two different modalities—EEG and fMRI—under the same experimental conditions. One of its key applications is determining brain activity maps (SPM) during interictal epileptiform discharges (IEDs) in patients with epilepsy. After removing artifacts related to the magnetic field acquisition from the EEG data, time points of these discharges—short-term disturbances in brain electrical activity occurring between seizures—are identified.
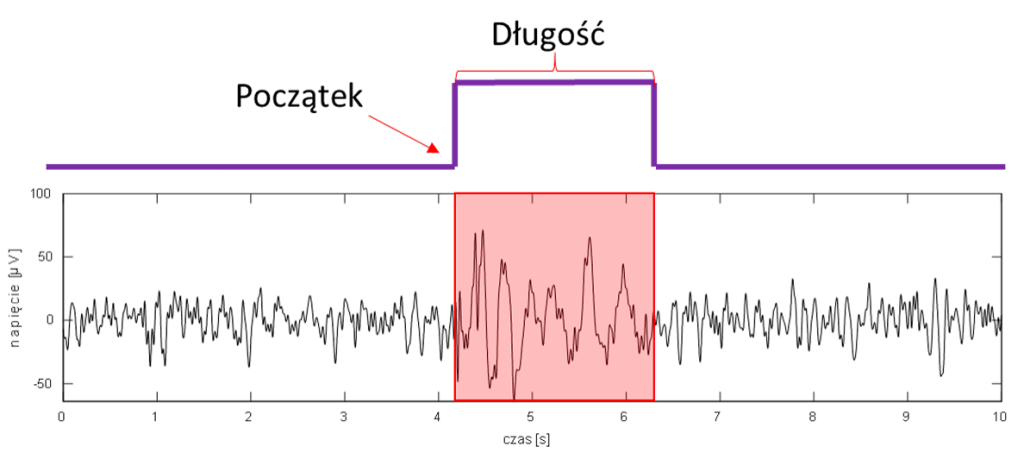
The interictal discharge recorded during the EEG-fMRI session, electrode CZ.
Statistical analysis of the EEG data is conducted synchronously with the fMRI images, allowing the calculation of statistical parametric maps (SPM). These maps show the brain areas where the BOLD signal increased during IEDs. The resulting map may indicate the location of epileptogenic foci. When compared with results obtained using other modalities (e.g., video-EEG, PET), it can significantly contribute to patient diagnosis.
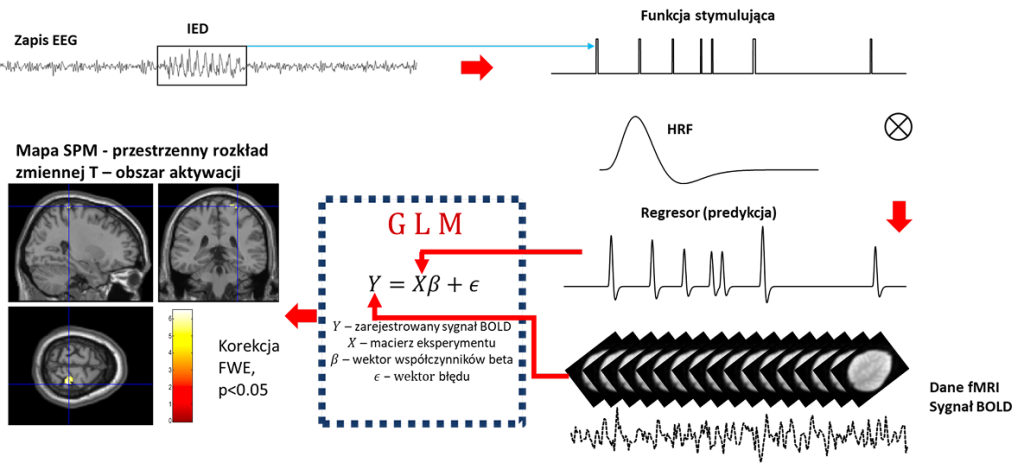
The data processing pipeline and identification of epileptogenic foci based on EEG-fMRI recordings.
Hyperpolarization
Hyperpolarization is a process that significantly amplifies the signal received by the MRI device. This technique allows for the observation of compounds whose signals are typically too weak to detect or are used to produce labeled substances (contrast agents).
Specifically, hyperpolarization makes it possible to prepare magnetically labeled pyruvate for imaging energy activity using an MR scanner. This method can serve as an alternative to FD-glucose imaging with PET scanners and provides the ability to use one device (MR) for both high-resolution anatomical and functional scans.
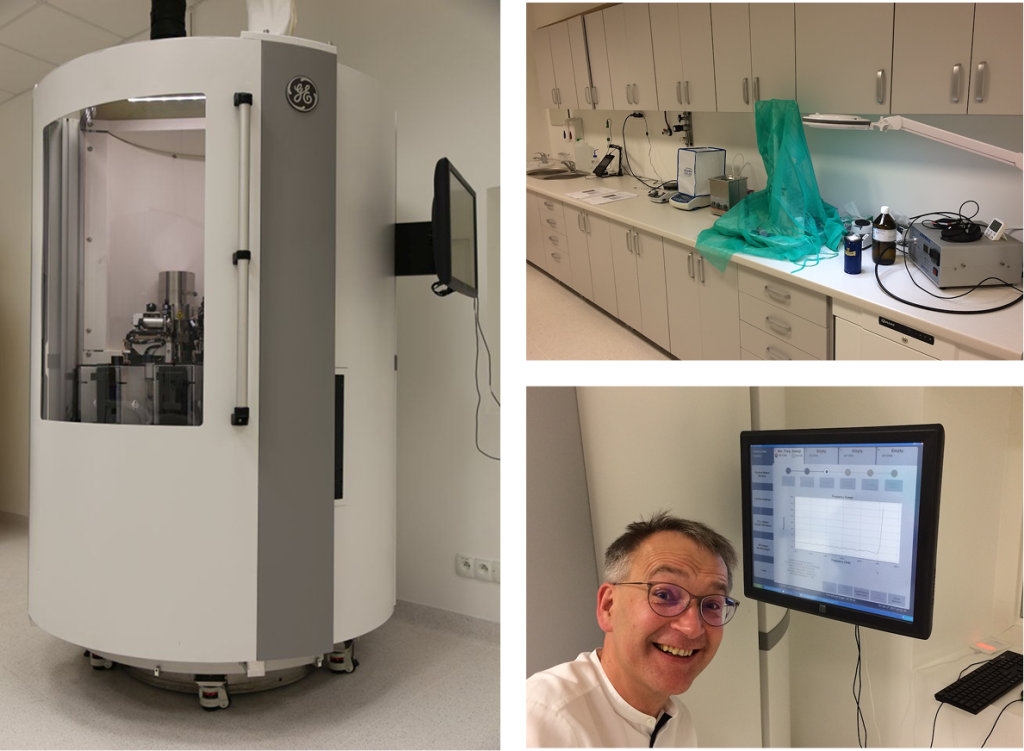
At CNSLab, we have a GE Spinlab device with a 5T magnetic field induction and the capability to polarize up to four samples simultaneously.
The data processing pipeline and identification of epileptogenic foci based on EEG-fMRI recordings.
CNS Lab - Results
Functional Connectivity in Patients with Epilepsy:
The CNSLab team conducted EEG-fMRI recordings in a group of patients with epilepsy and identified functional connectivity networks. The resting-state fMRI data was analyzed, taking into account interictal epileptiform discharges recorded using the EEG method. The group of epilepsy patients was compared to a healthy control group. The analysis revealed reduced functional connectivity in the patients' prefrontal medial cortex (MPFC), hippocampus, thalamus, amygdala, and parahippocampal gyrus. The results suggest that epilepsy affects the functional connectivity of subcortical structures, and the nature of these changes varies depending on the type of epilepsy.
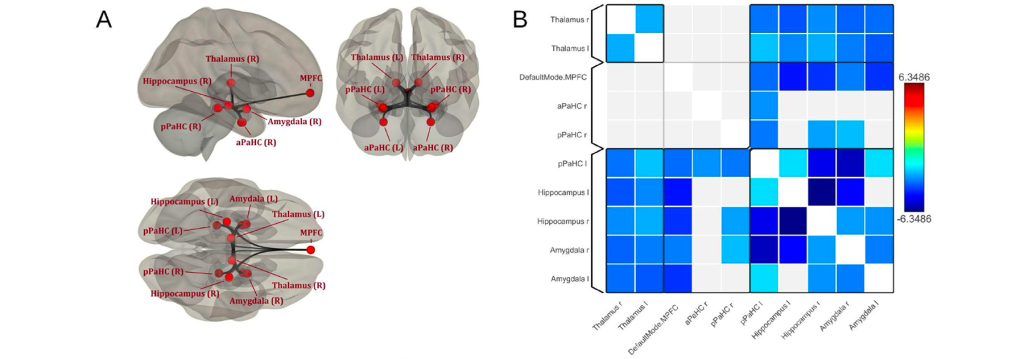
Results of Functional Connectivity Analysis in the Epilepsy Patient Group: A. Selected regions of interest: medial prefrontal cortex (MPFC), parahippocampal gyrus (anterior/posterior, left/right — aPaHC (L/R), pPaHC (L/R)), thalamus (L/R — left/right), hippocampus (L/R — left/right), amygdala (L/R — left/right). B. Differences in functional connectivity values between the patient group and the control group. The color scale represents the T value derived from parametric statistics (cluster threshold p < 0.05, FDR corrected, connection threshold: p < 0.05, FDR corrected). Analysis conducted using CONN.
Identifying Brain Regions Associated with Interictal Discharges in Epilepsy Patients:
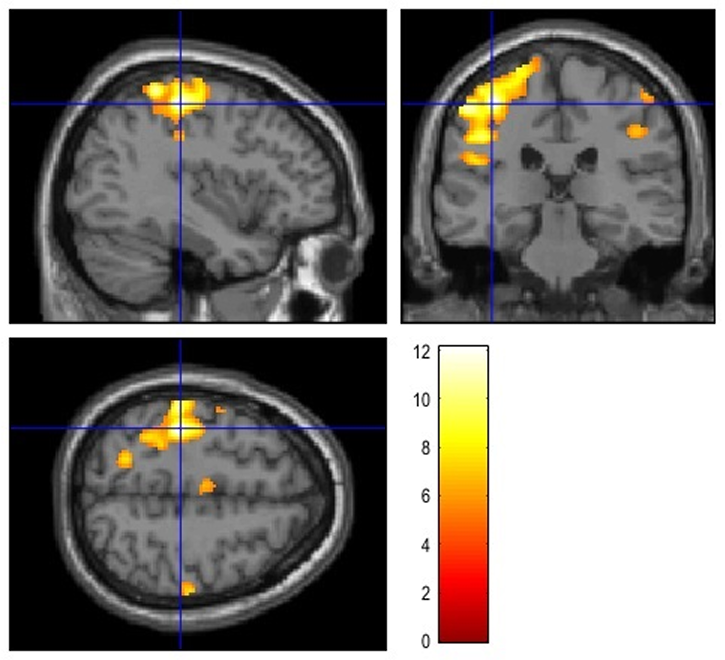
At CNSLab, research based on simultaneous EEG-fMRI measurements is conducted to identify potential epileptogenic foci in patients with epilepsy. Below are example results obtained from one patient. Simultaneous EEG-fMRI recording was performed, during which 26 interictal epileptiform discharges (IEDs) were registered across three 10-minute sessions. Based on the occurrence times and durations of IEDs, a regressor was created for statistical analysis of the fMRI functional data using the GLM model. The analysis performed in SPM12 software enabled the identification of the activation area with the highest statistical strength (highest T value), which may be associated with interictal discharges. The main 4 regions with the highest T-score value were located in the following anatomical structures: postcentral gyrus, planum polare, precentral gyrus, middle temporal gyrus.
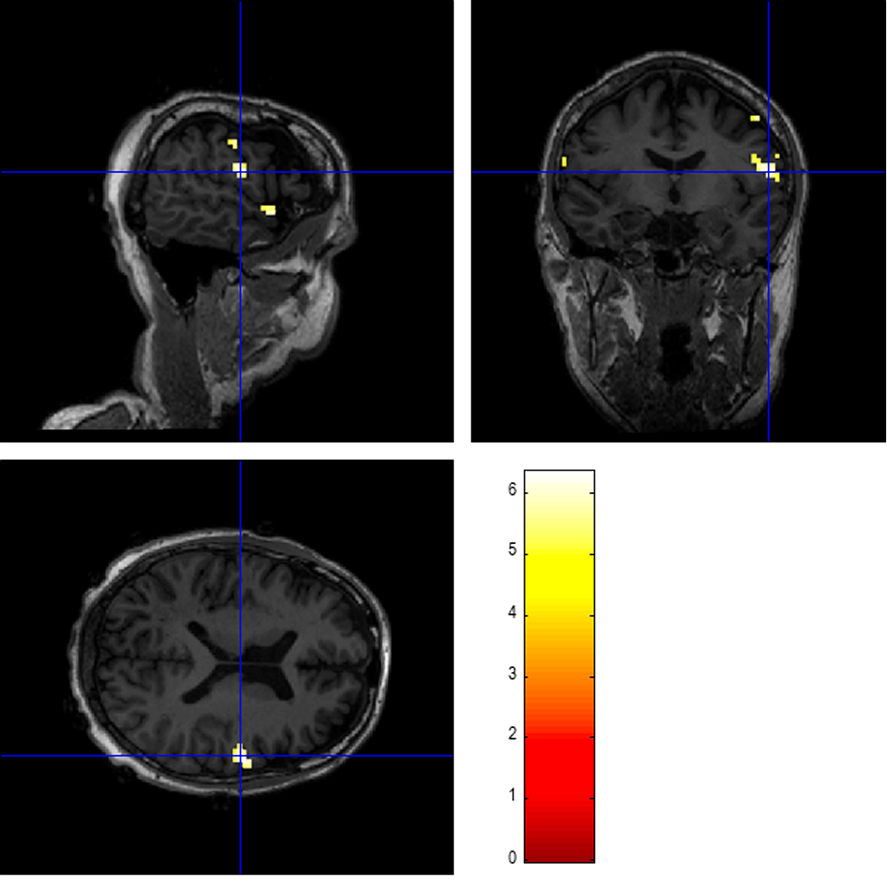
Results of the SPM Analysis of Functional fMRI Data for a Selected Patient, FWE correction, p<0.05. The color scale reflects the T-score values. The result was superimposed on an anatomical T1w image and presented in a slice showing the maximum T value.
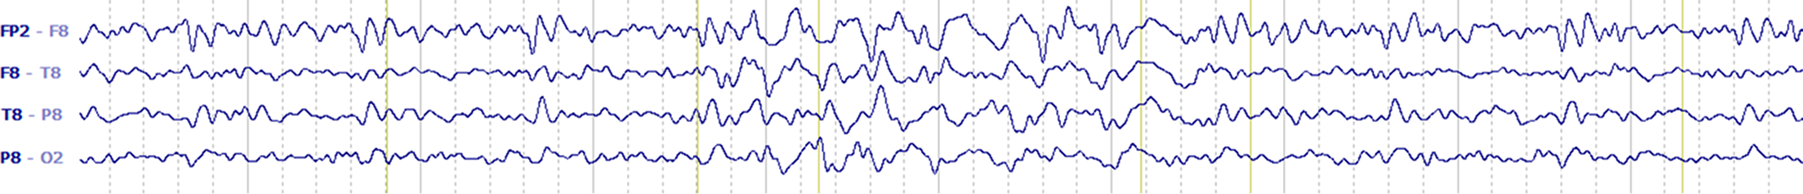
Example Interictal Epileptiform Discharge from 4 Selected Electrodes in the Longitudinal Bipolar Configuration (CURRY7):
Evaluation of Tumors and Multiple Sclerosis Lesions Using pMRI Perfusion Imaging:
At CNSLab, analyses based on perfusion curves obtained from DSC (dynamic susceptibility contrast) recordings are conducted to assess perfusion in selected brain areas. Below are the results from a patient with a lesion visible on the T1 image, which enhanced after contrast administration.
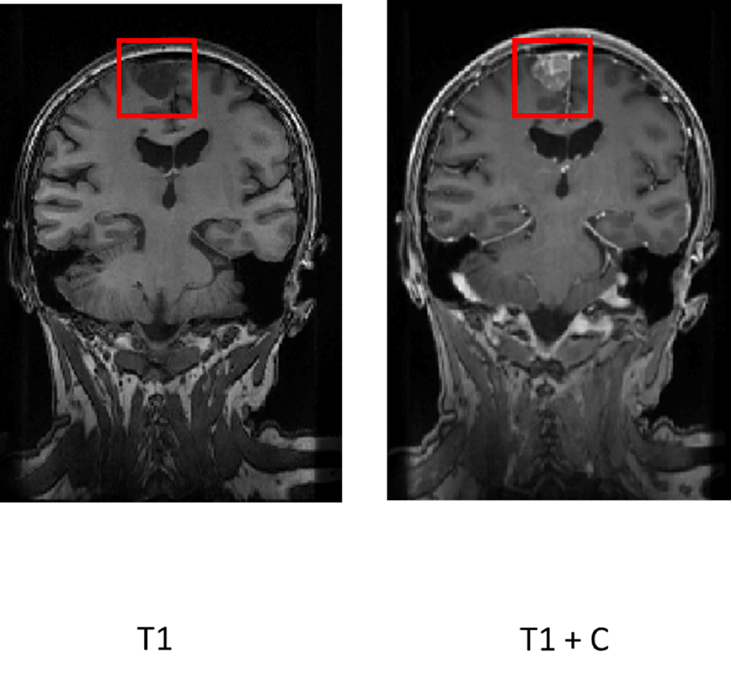
Region of Interest for pMRI Analysis in the Selected Patient: T1-weighted images before and after contrast administration are shown.
The contrast agent concentration curve was analyzed for both the tumor and a control area that did not show contrast-related enhancement. A high K2 value, which measures leakage of the agent, indicates perfusion disturbances in the region of interest.
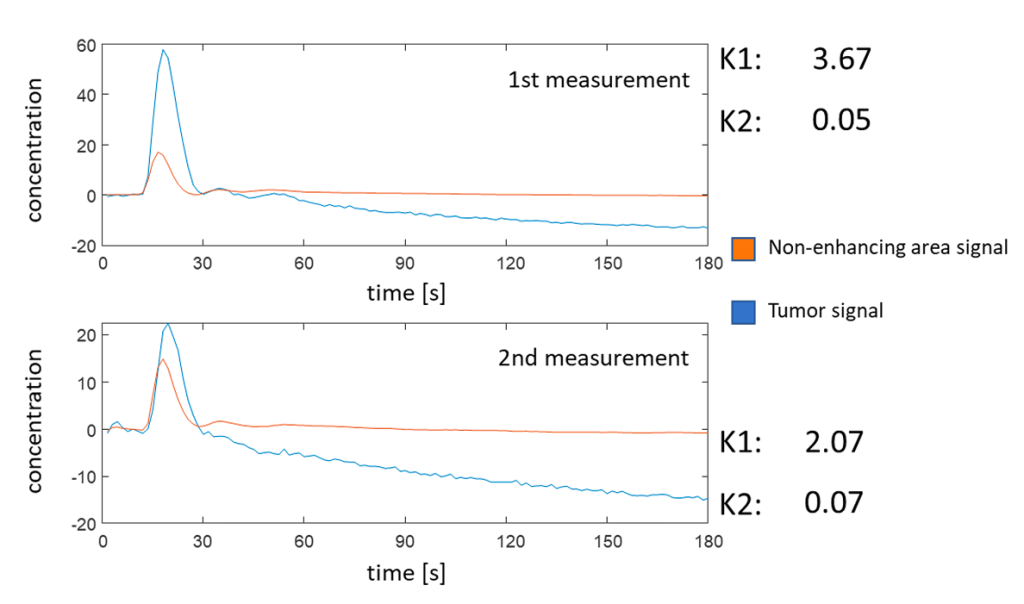
Results of the pMRI Analysis of Contrast Concentration Curves: The orange curve represents the tumor, and the blue curve represents the control area. The K1 and K2 values represent perfusion and contrast leakage effects, respectively.
Selected publications
- Hryniewicz, N., Rola, R., Ryglewicz, D., Piątkowska-Janko, E., Sawilska, A., & Bogorodzki, P. (2024). Differences in subcortical functional connectivity in patients with epilepsy. Neurologia i neurochirurgia polska, 58(5), 531-537. https://doi.org/10.5603/pjnns.99567.
- Rogala, J., Dreszer, J., Sińczuk, M., Miciuk, Ł., Piątkowska-Janko, E., Bogorodzki, P., Wolak, T., Wróbel, A., & Konarzewski, M. (2024). Local variation in brain temperature explains gender-specificity of working memory performance. Frontiers in human neuroscience, 18, 1398034. https://doi.org/10.3389/fnhum.2024.1398034
- Lewandowska, P., Jakubowska, N., Hryniewicz, N., Prusinowski, R., Kossowski, B., Brzezicka, A., & Kowalczyk-Grębska, N. (2022). Association between real-time strategy video game learning outcomes and pre-training brain white matter structure: preliminary study. Scientific reports, 12(1), 20741. https://doi.org/10.1038/s41598-022-25099-0).
- Kowalczyk-Grębska, N., Skorko, M., Dobrowolski, P., Kossowski, B., Myśliwiec, M., Hryniewicz, N., Gaca, M., Marchewka, A., Kossut, M., & Brzezicka, A. (2021). Lenticular nucleus volume predicts performance in real-time strategy game: cross-sectional and training approach using voxel-based morphometry. Annals of the New York Academy of Sciences, 1492(1), 42-57. https://doi.org/10.1111/nyas.14548